My Smart India Hackathon Experience
If you are facing issues rendering this page, here is a lite version of this blog post.
Smart India Hackathon is a national level event yearly organized by the Government of India. Calling this event a hackathon is misleading as the problem statements are declared well in advance (four months prior). Reputed government and private organizations such as the Indian Space Research Organization (ISRO), Defence Research and Development Organisation (DRDO), Ministry of Railways, Amazon Web Services, and Cisco participate and furnish students with research-based problems pertaining to their domain.
For students to qualify for the grand finale, they have to win an institute level hackathon. The selected teams from each institute (usually 4-5) submit their proposal to the respective organization, which then scrutinizes and nominates at most four teams for each problem statement.
It is a grueling albeit highly rewarding experience. I was leading a team of six and after a week of hunting, we picked a perfect problem statement that complemented our interests - Air pollution hot spots detection and identifying the source trajectories using ML/AI techniques (submitted by ISRO). Through this blog post, I intend to detail you about my team's experience pursuing this problem and mine as their leader.
Three months back, I was oblivious to the implications of air pollution. To be candid, like every diligent student in India, I studied environmental science for grades and nothing more. After spending the last two months investigating this problem, my views have radically changed. Air pollution is truly insidious and if not controlled (especially by the developing nations) can irrevocably change mankind's future.
As a prerequisite, each member of my team had to undergo the following NASA organized seminars -
- Fundamentals of Remote Sensing (NASA-ARSET) [notes]
- Data Analysis Tools for High-Resolution Air Quality Satellite Datasets (NASA-ARSET) [notes]
The steps we aimed for concretely championing this problem can be molded into three parts - extensive research, clear framing of thoughts, and a rigorous build.
Extensive research
Our research did not end with the seminars, in actuality we spend a whole month perusing papers and journals. At last, some of the research-papers/reports/articles that highly influenced us were -
- How Satellites Are Changing the Way We Track Pollution on the Ground (Internet Archive)
- Report by National Air Quality Index (Central Pollution Control Board, India) explaining Air Quality Index, Eclipsing, and Ambiguity.
- Estimating Ground-Level Concentrations of Multiple Air Pollutants and Their Health Impacts in the Huaihe River Basin in China
- A satellite-based geographically weighted regression model for regional PM2.5 estimation over the Pearl River Delta region in China
- Spaceborne Nitrogen Dioxide Observations from the Sentinel-5P TROPOMI over Turkey
- An empirical relationship between PM2.5 and aerosol optical depth in Delhi Metropolitan
Clear framing of thoughts
Early on we realized that converting satellite concentrations to ground-level data can be highly beneficial. Concretely, such a conversion can enable us to find the Air Quality Index of the pollutants (for each location) and can help to validate our findings. To make this a possibility, we decided to design a Geographically Weighted Regression Model. Finally, to detect locations with high air-pollution concentration, we used the clustering technique - DBSCAN. From Scikit-Learn's documentation, DBSCAN is particularly useful for non-flat geometry and uneven cluster sizes.Our final proposal was (as submitted to ISRO):
We are going to aggregate data from satellites - Sentinel 5P and ERA5. The aggregated data is then used for identifying hotspots, predicting forward/backward air pollution source trajectories, and identifying locations where long term occurrences of such hotspots are seen.
To measure the level of pollution of a hotspot, an AQI (Air Quality Index) value is calculated based on the guidelines provided by the C.P.C.B, India. Various satellite-obtained pollutant concentrations(SO2, NO2, CO, PM2.5) and geographic parameters (such as Boundary Layer Height, Wind speed, etc.) will be an input to our geographically weighted regression model which will help estimate ground-level AQI concentrations.
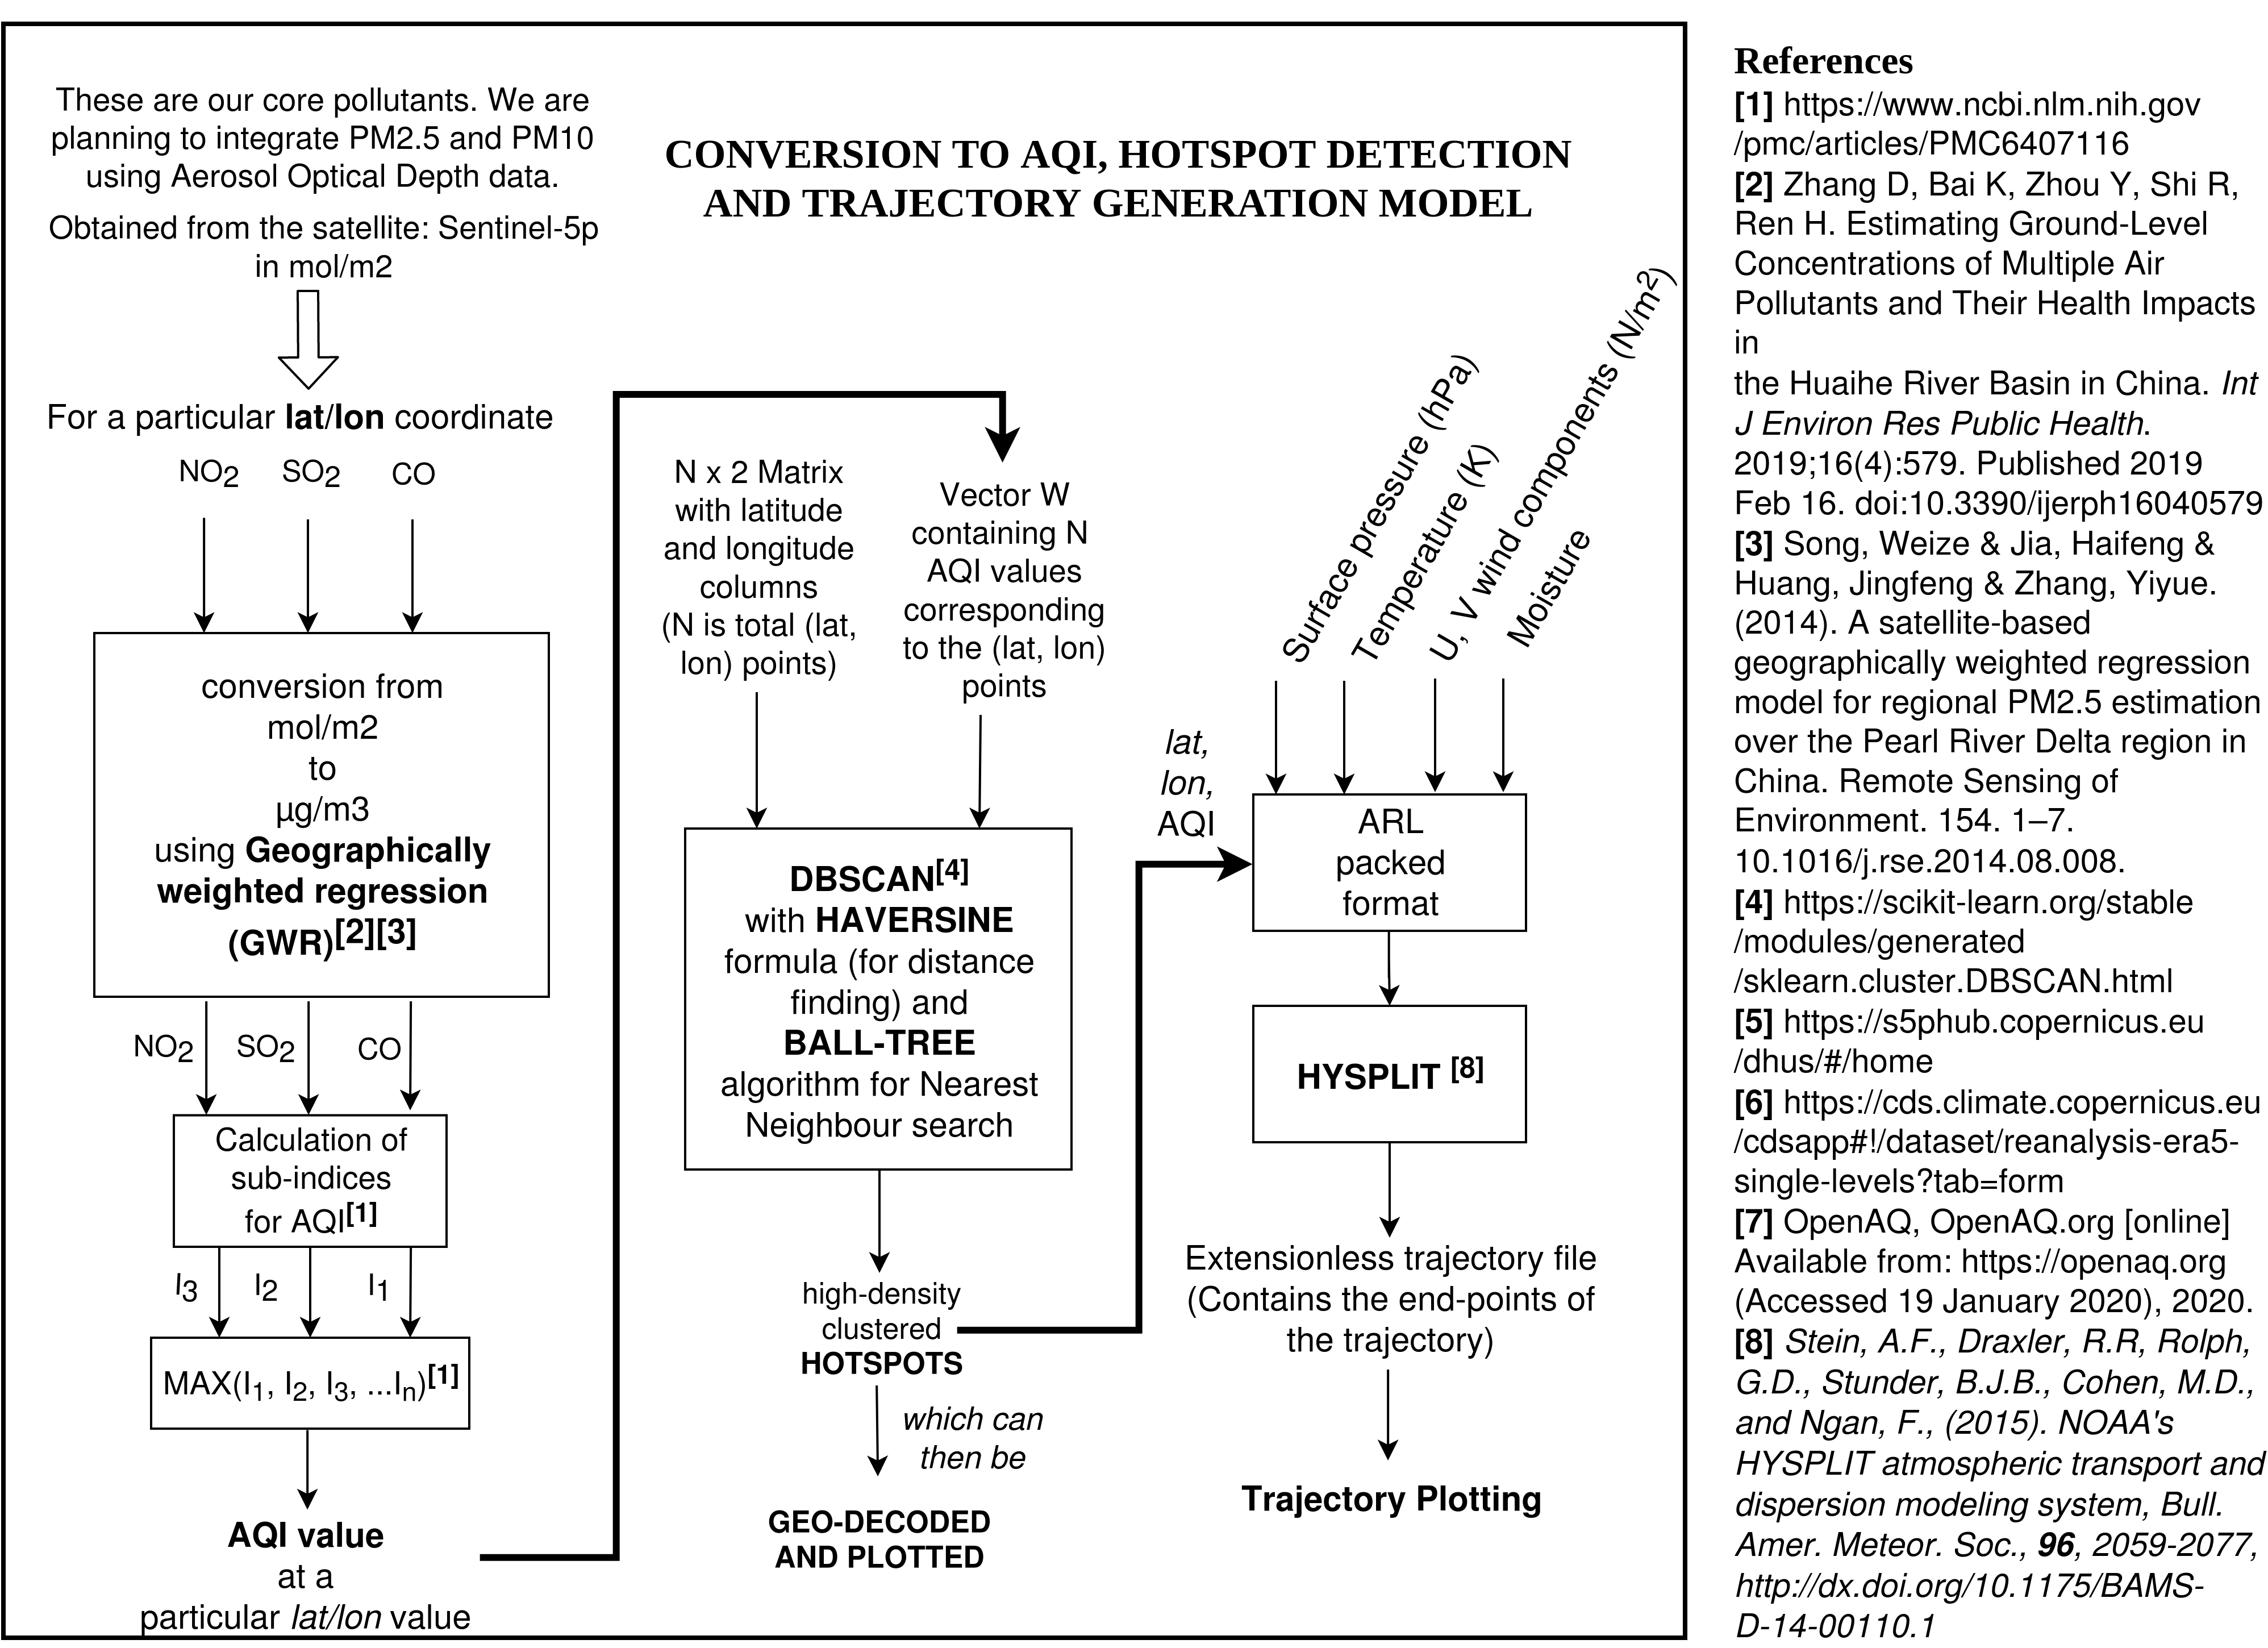
A clustering algorithm (DBSCAN) will be applied to the AQI concentrations to detect hotspots. HYSPLIT model will be used for predicting source trajectories. For validation, predicted ground-level concentrations are compared against ground station data. Hotspots and source trajectories are being visualized over a given timeline. Exact locations of hotspots are detected using geo-decoding techniques.
The charts we designed for our proposal were -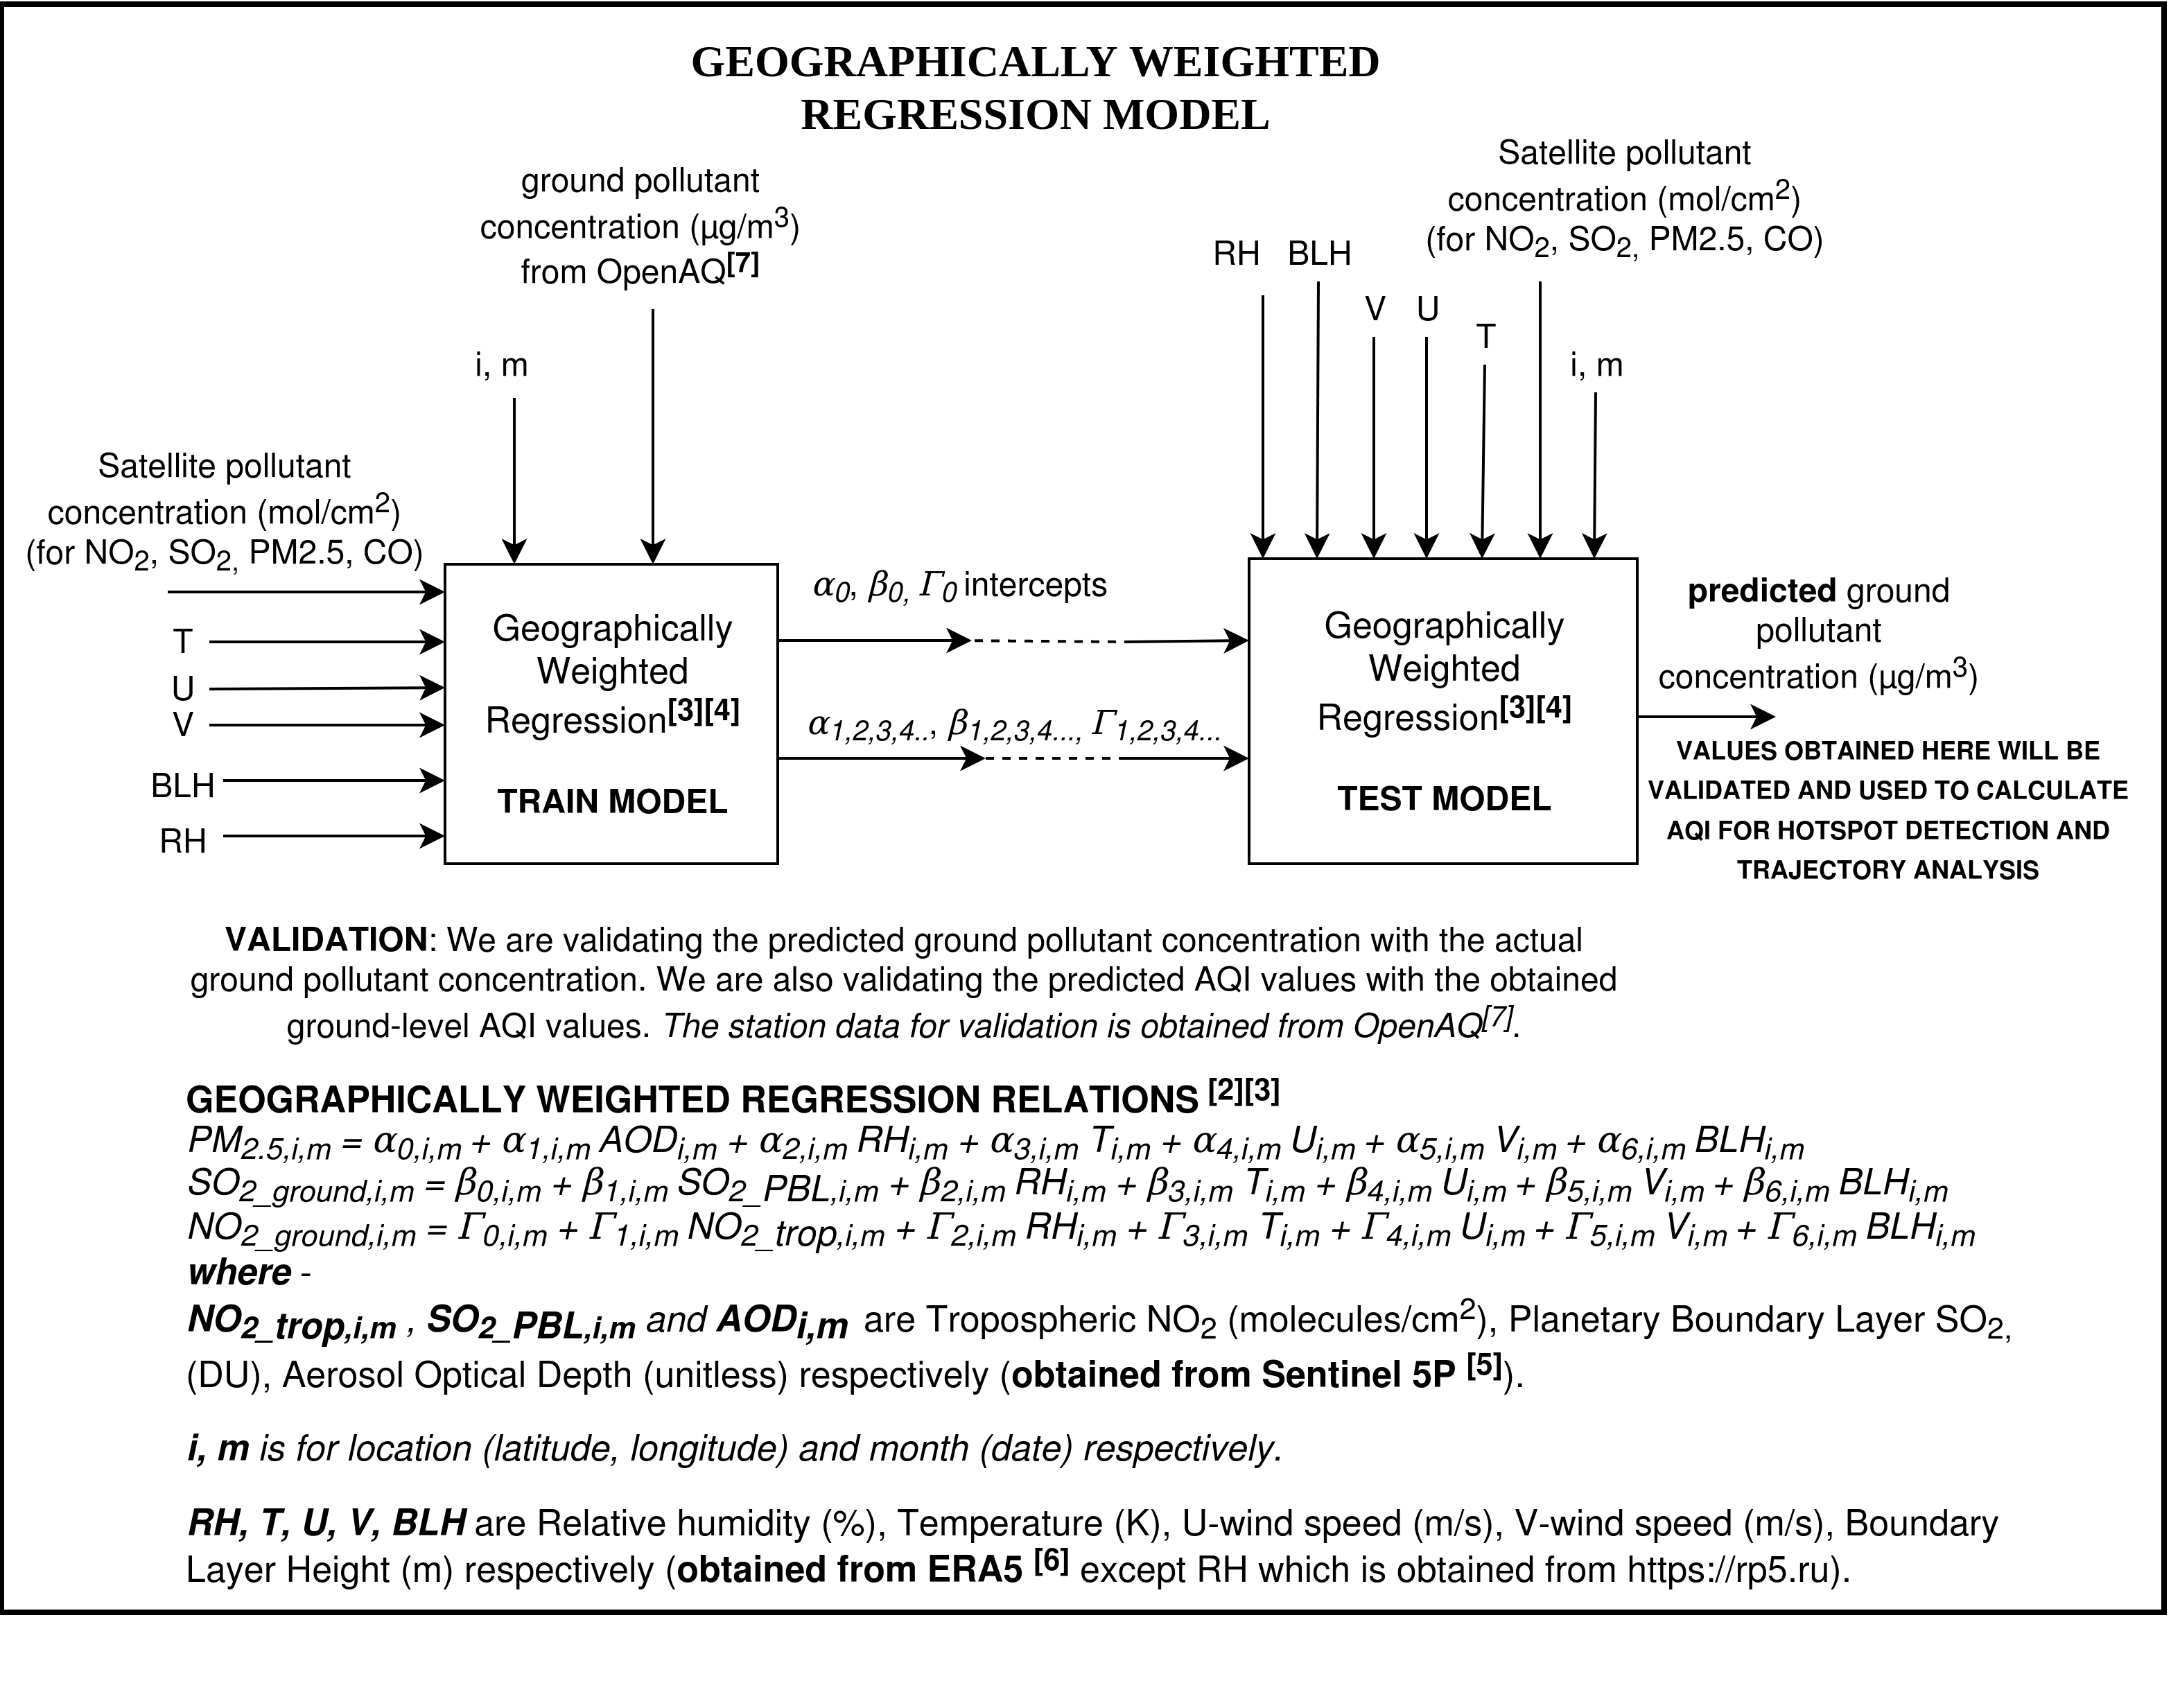
Rigorous build
We created a prototype based on the above architecture and were selected by our institute for the next round. The code for our prototype is available on Github. One of the prototypes we designed (for hotspot detection) was -
The above GIF shows the pathetic state of the Delhi-NCR region during December 2019. The map is formed after selecting the most polluted regions in India (top 1 percentile). Geodecoding is used to find the exact locations where satellite had made such observations. Sentinel 5P was used as our primary data source. The numbers in the boxes indicate the number of observations made by the satellite in that region. The blue hover helps visualize the clusters.
Here is the uncompressed GIF [4 MB]
Luck favors the prepared mind. -- Louis Pasteur
Were we underprepared, was there an error of judgment on ISRO's part, thoughts... blames..... excuses.......
I am optimistic that the experience I have gained in the past 3 months, will prove to be beneficial. Presently, we are planning to write a research paper delineating our findings.
←